

 IND
IND UAE
UAE SA
SA



Two Clusters, Same Hardware, Different Economics
Two organizations each deploy 64 identical GPUs. Same accelerator, same generation, same networking fabric, same facility class. One books the cluster near-continuously across training and inference, keeps queues short, and ships a steady volume of production traffic through it. The other buys the same capacity as insurance against future demand, runs it in bursts, and leaves much of it idle between projects.
Eighteen months later, the two organizations report wildly different numbers when asked what their AI compute actually costs. The hardware bill was nearly identical. The economics were not.
This is the starting point for any serious discussion of AI Factory economics: the price tag on a GPU tells you almost nothing about what a unit of AI output actually costs an organization. What determines that number is a chain of decisions — utilization, power draw, cooling design, network topology, storage architecture, and workload shape — that sits between the invoice for the hardware and the token that eventually reaches a user or a downstream system.
The real question this article works through is narrower and more useful than "how expensive is AI": what does one unit of useful AI compute actually cost once the full AI Factory is accounted for? Cost per token is one way to answer that. It is not the only way, and used carelessly it can mislead as easily as it can inform.

What AI Factory Economics Actually Means
AI Factory economics is the study of how capital, compute capacity, utilization, power, cooling, networking, storage, and operations combine to determine the true cost of producing useful AI output — a token, an inference, a completed task, or a training milestone — rather than treating GPU acquisition price as a proxy for AI cost.
The chain looks like this in practice:
Looking only at the second box in that chain — GPU acquisition cost — and drawing conclusions about "AI cost" skips every step that actually determines the unit economics. A cluster can be fully paid for and still be economically weak if utilization is low, power costs are high relative to output, or the network forces GPUs to sit idle waiting on data. Conversely, a comparatively modest cluster run with disciplined scheduling and efficient inference serving can out-economize a much larger, poorly utilized one.
There is no single universal AI Factory metric. Depending on the workload and business model, the right lens might be cost per token, cost per inference, cost per completed task, cost per GPU-hour, cost per training run, or revenue per GPU-hour. Reducing AI Factory economics to one number is itself a source of bad decisions.
The Five Economic Variables That Matter Most
Five variables explain most of the variance in AI infrastructure unit economics:
1. Compute Capacity
How much useful compute — GPUs, memory, interconnect — is actually installed and available to workloads.
2. Utilization
How much of that installed capacity is actually producing useful training or inference work, versus sitting idle or queued.
3. Power
How much electricity the GPUs, servers, and supporting facility infrastructure consume to deliver that compute.
4. Infrastructure Overhead
What is spent on cooling, networking, storage, facility space, and day-to-day operations to keep compute usable.
5. Output
The useful AI work actually produced — tokens, predictions, completed tasks — that the previous four variables were spent to generate.
Cost without utilization is close to meaningless as an economic signal. Capacity without output is stranded capital sitting on a balance sheet. Every section below traces back to one of these five variables.
Cost Per Token — What It Really Measures
Cost per token measures the cost of generating or processing a unit of model input or output, under a defined workload and a defined accounting boundary. The phrase gets used loosely, and the accounting boundary is usually the part left unstated — which is exactly the part that changes the number by an order of magnitude.
At minimum, three distinct things get called "cost per token," and they are not interchangeable:
Marginal Inference Cost
- The cost of operating the infrastructure for one additional request, holding the cluster and its fixed costs constant
- Useful for short-term capacity and pricing decisions
- Excludes amortization, facility build-out, and most fixed overhead
Fully Loaded Inference Cost
- GPU infrastructure + CPU/RAM + storage + networking + power + cooling + facility + operations + software/licensing + amortization
- The number that should inform build-vs-rent and pricing decisions
- Rarely disclosed publicly by any provider
The third figure — provider price per token — is what a customer is billed. It is shaped by market positioning, margin targets, and competitive pressure as much as by underlying cost. Customer price does not equal provider cost, in either direction: a provider can price below fully loaded cost to win volume, or price well above marginal cost where differentiated infrastructure or compliance requirements justify it.
Whenever this metric is reported — internally or externally — the accounting boundary should be stated alongside it. "Cost per token" without a defined scope is a number without a unit.
Real GPU and system prices referenced here (for example, NVIDIA B300 configurations) are drawn from Cyfuture AI's published pricing research and industry reporting, with sources and dates noted. Anywhere this article builds a cost-per-token or cost-per-GPU-hour calculation, every input is labeled an illustrative assumption — not a market quote — because electricity rates, PUE, utilization, and throughput vary by facility and are not interchangeable across providers.
Why GPU Utilization Is the Central Economic Variable
A cluster of 10,000 GPUs run at low utilization can be economically worse than a cluster a fraction of the size run efficiently, because the fixed costs of ownership — amortization, facility, power contracts, support — accrue whether or not the GPU is doing useful work.
Utilization itself isn't one number. Useful analysis separates:
- Active utilization — the fraction of GPU-hours actually assigned to a running job at a given moment
- Average utilization — active utilization averaged over a billing period or reporting window
- Peak utilization — the highest observed utilization, useful for capacity planning but not for cost
- Reserved vs idle capacity — GPUs held for burst demand or failover versus GPUs with no assigned workload at all
- Queue time — time jobs spend waiting for GPU allocation, which doesn't show up as GPU cost but does show up as project delay
Illustrative example — not a market quote. Suppose an operator has 100 GPUs available. At 20% useful utilization, the equivalent of roughly 20 GPUs' worth of capacity is producing work at any given moment — the other 80 GPU-equivalents of paid-for capacity are not contributing output during that window. At 70% utilization on the same 100 GPUs, the useful compute delivered is more than three times higher, without adding a single additional GPU or dollar of hardware spend. This is illustrative arithmetic to show the mechanism, not a claim about any specific facility's real utilization rate.
The important distinction is between installed capacity — what was purchased or provisioned — and useful compute delivered — what actually ran a job. AI Factory economics are ultimately a story about the gap between those two numbers.

GPU Utilization vs GPU Efficiency
High utilization and good economics are not the same thing. A GPU can report 90% utilization while running an inefficient workload — poor batching, unnecessary precision, an oversized model for the task — and still deliver weak cost-per-token or cost-per-task outcomes. 90% utilization does not automatically mean 90% efficiency.
Useful signals sit at different layers: GPU utilization (is the chip busy), memory utilization (is available HBM being used well, particularly relevant for memory-bound models), power efficiency (useful work per watt), throughput in tokens per second, and — the metric that actually matters commercially — useful output per GPU-hour. Optimizing for utilization alone can push teams toward keeping GPUs busy with low-value work rather than toward the harder problem of increasing useful output per unit of infrastructure.
The Economics of GPU Compute
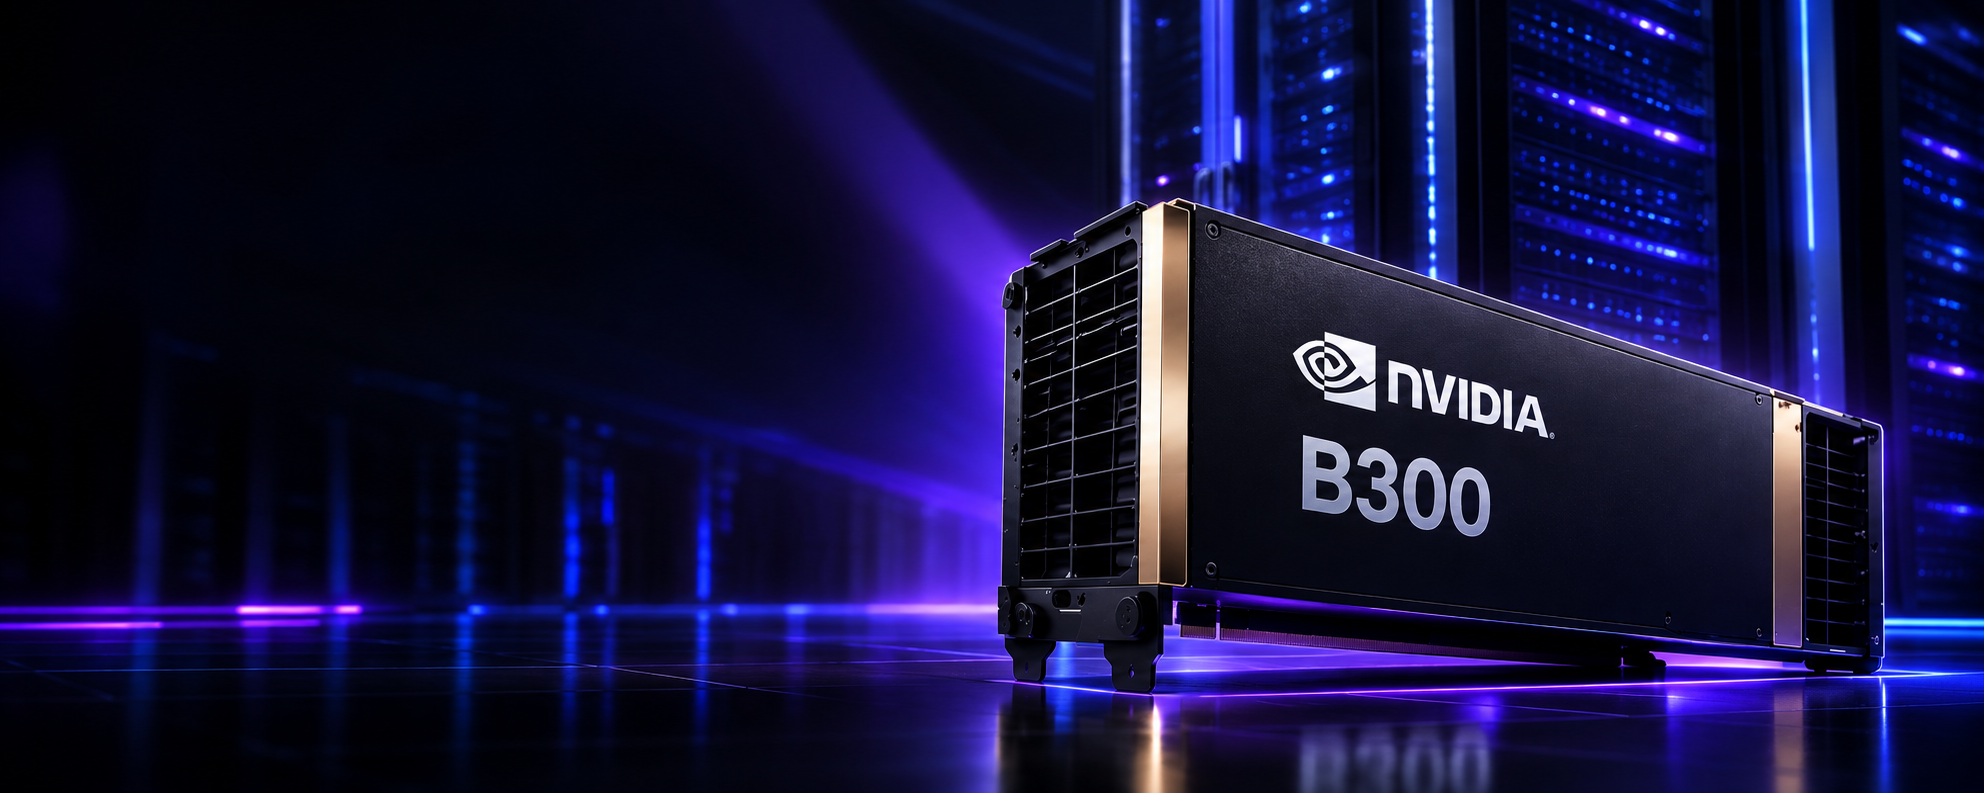
GPU-class accelerators differ in ways that materially change the economics of a given workload — not just in raw throughput. Cyfuture AI's own NVIDIA B300 GPU Cloud is a useful illustration: the B300 (Blackwell Ultra) ships with 288 GB of HBM3e memory per GPU against the B200's 192 GB, at a reported standalone price near $53,000 per GPU and $400,000–$500,000 for an 8-GPU DGX system. For workloads bound by memory capacity — long-context inference, mixture-of-experts serving, trillion-parameter training — that extra memory can remove the need to shard a model across additional GPUs, which changes the unit economics even though the sticker price per GPU is higher.
The reverse also holds. A workload that doesn't need 288 GB of HBM3e per GPU won't benefit proportionally from paying for it — a B200, or for many professional and mixed inference/visualization workloads, an NVIDIA RTX PRO 6000, can be the more economical choice for that specific job. The point is not to rank accelerators in the abstract; it's that GPU class, workload shape, memory requirement, concurrency, and precision together determine which accelerator produces the best cost per useful output — not which one has the highest headline FLOPS.
GPU Price Is Not GPU Cost
A GPU's purchase price does not translate directly into its contribution to the cost of each token it helps produce. The relevant figure is the amortized cost of a useful GPU-hour, which depends on how long the GPU stays in service and how much of its available time is actually put to work.
Low expected utilization inflates cost per useful GPU-hour even when the purchase price and useful life are unchanged, because the same fixed cost is spread across fewer hours of actual work. This is the mechanical reason two organizations with identical hardware can report very different unit economics.
CapEx vs OpEx in an AI Factory
Owning infrastructure and consuming it through a provider shift where each cost category sits on the balance sheet, but neither model is automatically cheaper — it depends on utilization, workload duration, and how much operational risk an organization wants to carry.
| Cost Category | CapEx / Build Model | Consumption / Rental Model |
|---|---|---|
| GPU acquisition | Major upfront cost | Usage-based / recurring |
| Servers | Owned | Provider-managed, depending on model |
| Power infrastructure | Customer | Provider |
| Cooling | Customer | Provider |
| Networking | Customer | Provider / shared |
| Scaling | Bound by procurement cycle | More flexible, usage-driven |
| Depreciation | Customer | Provider |
| Utilization risk | Customer | Provider shares or manages it, depending on contract |
Power Economics and PUE
Power cost in an AI Factory has two layers: IT Load — the energy the GPUs, CPUs, and servers themselves draw — and Facility Load — the additional energy consumed by cooling, power distribution, and UPS systems to keep that IT equipment running.
A PUE of 1.3 (an illustrative figure, not a claimed industry average) means that for every unit of energy the GPUs and servers consume, an additional 0.3 units go to cooling, power distribution, and other facility overhead. A facility's actual PUE depends on climate, cooling architecture, and design age, and varies enough between operators that it should always be sourced and dated rather than assumed.
Because GPU power draw varies by workload, electricity rates differ by region and tariff category, and PUE differs by facility design, there is no single "cost to run a GPU for an hour" that applies universally. Any number quoted without a stated power draw, electricity rate, and PUE should be treated as an example, not a benchmark.
Cooling Economics in an AI Factory
Modern high-density accelerators draw enough power that air cooling alone becomes impractical at rack scale. Direct-to-chip liquid cooling routes coolant to the GPU package directly, immersion cooling submerges hardware in a dielectric fluid, and both introduce their own capital equipment, coolant distribution infrastructure, and maintenance requirements compared with traditional air-cooled design.
Cooling shows up in AI Factory economics through capital expenditure (the cooling plant itself), operating expenditure (pumping, chillers, maintenance), facility capacity (how much compute density a given footprint can support), and — often overlooked — the opportunity cost of a retrofit timeline that delays deployment. Liquid cooling can enable materially higher rack density in the right design, but it is not a universal requirement for every AI workload, and the decision should be driven by the power density of the chosen hardware rather than by trend-following.

Power and Cooling Are Part of Compute Economics, Not an Afterthought
High-density AI infrastructure has to account for both the energy the compute consumes and the infrastructure required to remove the resulting heat. Cyfuture AI's liquid-cooled AI data centers are built around that reality rather than retrofitted for it.
Networking and Storage Have an Economic Cost Too
AI Factory networking exists to move data between GPUs during distributed training, between storage and GPUs during data loading, and between inference nodes and end users. InfiniBand, RDMA-capable high-speed Ethernet, and switch topology all determine whether GPUs spend their time computing or waiting. Poor networking shows up economically as lower realized GPU utilization, longer training wall-clock time, increased queue times, and — in the worst case — a need to buy more cluster capacity simply to compensate for coordination overhead that better networking would have eliminated.
Storage carries a parallel risk. Datasets, checkpoints, and model artifacts all need to move fast enough to keep GPUs fed; cheap storage that cannot sustain the required throughput becomes expensive the moment it causes GPU starvation — GPUs sitting idle waiting on data while still accruing their full fixed cost. A storage layer should be evaluated on cost per unit of throughput delivered to the GPU fleet, not cost per terabyte in isolation.
Training Economics vs Inference Economics
Training and inference behave differently enough economically that mixing them into one blended number obscures more than it reveals.
| Economic Variable | Training | Inference |
|---|---|---|
| Main output | Model weights / checkpoints | Tokens / predictions |
| Utilization pattern | Large, sustained jobs | Request-driven, variable |
| Power profile | High and steady during long runs | Variable with traffic |
| Networking demand | Often the binding constraint | Depends on serving architecture |
| Storage demand | Datasets + checkpoints | Model artifacts + request data |
| Primary cost metric | Cost per training run / model milestone | Cost per token / per request |
| Scaling pattern | Distributed compute across a fixed job | Replication and autoscaling with demand |
Cost Per Token Vs Cost Per Completed Task
A single user request in an agentic system can require 5,000 input tokens, 1,500 output tokens, a retrieval step, a reranking pass, one or more tool calls, and several separate model invocations before it resolves. Cost per token, measured narrowly, captures only a slice of what that request actually consumed. Cost per completed task — or cost per successful task, once retries and failures are accounted for — is often the more decision-relevant number for anything built on AI agents or multi-step retrieval pipelines, because it reflects the full chain of infrastructure activity one user objective triggers, not just the token count of the final answer.

Need Flexible GPU Capacity for AI Workloads?
AI infrastructure economics change materially when organizations can align GPU capacity with actual demand instead of carrying unused capacity between projects.
The Cost of Idle GPUs
An idle GPU is not a free GPU. It still carries amortization or lease cost, its share of facility overhead, support contract cost, and often reserved-capacity cost if it was provisioned for burst demand that hasn't materialized. This is sometimes described as stranded compute — capacity that was paid for but is not converting into useful output. In owned infrastructure, stranded compute is a direct hit to unit economics; in consumption-based models, the equivalent risk shows up as paying for reserved capacity that goes unused, which is why contract terms and commitment levels matter as much as the headline hourly rate.
AI Factory TCO — What Should Be Included
A defensible total cost of ownership model pulls together hardware, facility, software, operations, and financing costs rather than stopping at the GPU line item.
Hardware
GPUs, CPUs, RAM, storage media, servers, and networking equipment.
Facility
Rack space, power distribution, UPS, cooling plant, and physical build-out.
Software
OS, drivers, ML frameworks, orchestration, monitoring, and licensing where applicable.
Operations
Infrastructure engineering, day-to-day data-center operations, maintenance, and support.
Financial
Depreciation schedule, financing cost, insurance, taxes, and hardware refresh cycles.
Accounting treatment for depreciation and financing varies by organization, which is one more reason TCO figures from different sources are rarely directly comparable without checking the underlying assumptions.
Build vs Rent — How the Economics Change
| Economic Variable | Build / Own | GPU Cloud / GPU-as-a-Service |
|---|---|---|
| Upfront capital | High | Lower |
| Utilization risk | Customer bears it fully | Provider shares or absorbs it |
| Power and cooling | Customer builds and operates | Included in the service |
| Hardware depreciation | Customer | Provider |
| Scaling | Procurement-cycle driven | Usage-driven, faster to adjust |
| Long-term predictability | Strong for known, steady workloads | Depends on pricing and contract terms |
| Short or uncertain projects | Often capital-inefficient | More flexible |
| Infrastructure control | High | Varies by provider and tier |
Renting is not automatically cheaper, and buying is not automatically wasteful. The comparison only resolves once utilization, workload duration, and the value of capital tied up elsewhere are put into the same model.
AI Factory Economics in India
India-specific factors shape AI Factory economics in ways that don't show up in a generic global model: electricity tariffs vary by state and by commercial-versus-industrial classification; data residency requirements under the DPDP Act 2023 influence where compute can physically sit; and GPU allocation for the newest accelerator generations has historically been directed first toward hyperscalers, which affects lead times for enterprise buyers evaluating a build option.
Cyfuture AI operates liquid-cooled AI data centers from Noida, Jaipur, and Raipur specifically to keep India-hosted GPU capacity — including NVIDIA B300 and B200 configurations — available on a consumption basis without enterprises needing to build cooling and power infrastructure from scratch. Any specific electricity rate or facility cost figure used in a real capacity-planning exercise should be sourced to the applicable state tariff schedule and commercial category rather than assumed from a national average.
- Placement
- Immediately after the India economics section
- Image type
- Real photograph of an Indian data center or modern AI compute facility
- Preferred source
- Established Indian data-center operator, NVIDIA, infrastructure provider, or reputable Indian technology publication
- Search query
- India AI data center GPU infrastructure real photograph
- Alt text
- AI Factory economics and GPU infrastructure in India
- Filename
- ai-factory-economics-india-data-center.jpg
- Avoid
- Generic Indian city skyline stock photography
Worked Example: Cost Per GPU-Hour and Cost Per Million Tokens
Illustrative example — not a market quote. Every figure below is a stated assumption for demonstration purposes only.
- Assumed hardware: 1 high-end data-center GPU, useful life of 4 years (35,040 hours), assumed 65% average utilization → ~22,776 useful GPU-hours/year
- Assumed amortized hardware cost: illustrative $15,000/year straight-line (assumed purchase price ÷ useful life, not a quoted market price)
- Assumed power draw: 1,000W GPU+server average, illustrative electricity rate of $0.10/kWh, illustrative PUE of 1.3
- Assumed throughput: illustrative 2,000 output tokens/second sustained during active utilization windows
Change only the utilization assumption from 65% to 30%, holding every other input fixed, and the annual infrastructure cost is spread across far fewer useful hours — cost per useful GPU-hour and cost per million tokens both rise substantially, without a single dollar of additional spend. That is the mechanism behind the earlier claim that fixed costs are distributed differently depending on how much useful work actually runs through the hardware. This example should not be read as a real Cyfuture AI rate or a market benchmark — it exists purely to show how the pieces combine.

Measure Compute by Useful Output, Not Installed Capacity
GPU utilization, power consumption, and infrastructure cost only become meaningful once they are connected to the amount of useful AI work actually being delivered.
Metrics an AI Factory Should Actually Track
| Metric | Why It Matters |
|---|---|
| GPU utilization | Baseline capacity efficiency signal |
| GPU memory utilization | Reveals memory pressure independent of compute load |
| Tokens/sec | Raw AI throughput under a given workload |
| Cost/token | Unit economics for inference, with stated accounting scope |
| Cost/request | Application-level economics beyond raw tokens |
| Cost/task | End-to-end economic efficiency for multi-step and agentic workloads |
| Power/GPU | Energy efficiency at the hardware level |
| PUE | Facility-level overhead on top of IT load |
| Network utilization | Cluster-wide coordination efficiency |
| Storage throughput | Data pipeline efficiency and GPU-starvation risk |
| Queue time | Capacity planning signal independent of cost |
| Failed job rate | Operational efficiency and wasted-compute signal |
No single row in this table is sufficient on its own — utilization without cost per token hides inefficiency, and cost per token without utilization hides stranded capacity.
What AI Factory Operators Should Optimize
Increase Useful Utilization
Better scheduling, workload placement, and multi-tenant packing to reduce idle and reserved-but-unused capacity.
Improve Inference Efficiency
Batching, quantization, and optimized serving runtimes to raise useful tokens produced per GPU-hour.
Reduce Data Movement
Storage and network architecture designed around avoiding GPU starvation, not just raw capacity.
Match GPU to Workload
Avoid over-provisioning memory or compute class relative to what the actual model and traffic pattern require.
Improve Capacity Planning
Align installed compute with realistic demand forecasts rather than worst-case burst assumptions alone.
Maximizing utilization is not automatically the right target. Pushing utilization very high can create queueing, added latency, and reduced availability headroom. A healthy AI Factory balances utilization against service-level requirements rather than chasing 100% as an end in itself.
Why GPU-as-a-Service Changes AI Factory Economics
The underlying shift with GPU-as-a-Service is from owning capacity to consuming it — CapEx moves off the balance sheet, utilization risk is shared with or absorbed by the provider, and scaling stops being bound by a procurement cycle. That shift does not eliminate all economic risk: buyers still need to examine hourly and monthly rates, storage and bandwidth charges, data-transfer costs, and any minimum commitment terms before assuming a rental model beats ownership for their specific workload.
Turn GPU Capacity Into a Variable Cost
For workloads with uncertain demand or changing capacity requirements, consumption-based GPU infrastructure reduces the need to own every layer of the physical stack.
The Real Unit of AI Factory Economics
The GPU is not the economic unit. The server rack is not the economic unit. Even the token, taken alone, is not always the final economic unit — for agentic and multi-step workloads, a task or a business outcome is often the number that matters. Which unit is right depends entirely on the application: a foundation-model API provider reasonably optimizes around cost per million tokens; an enterprise running an internal support-automation agent reasonably optimizes around cost per resolved ticket.
The economically efficient AI Factory is not necessarily the one with the most GPUs. It is the one that converts compute, power, infrastructure, and capital into the greatest amount of useful AI work at an acceptable cost. That conversion efficiency — not the size of the hardware order — is what AI Factory economics is actually measuring.
Decision Framework: Where to Focus First
Frequently Asked Questions
AI Factory economics is the study of how capital, GPU compute, utilization, power, cooling, networking, storage, and operations combine to determine the true cost of producing useful AI output — a token, an inference, or a completed task — rather than treating GPU purchase price as a stand-in for AI cost.
Compute capacity, utilization, power consumption, infrastructure overhead (cooling, networking, storage, facility), and the volume of useful output actually produced. Any one of these viewed in isolation gives a misleading picture of true cost.
Cost per token measures the cost of generating or processing one unit of model input or output, under a defined accounting boundary. It can refer to marginal inference cost, fully loaded infrastructure cost, or the price a provider charges — three distinct figures often conflated as one.
Divide total inference cost — GPU, CPU/RAM, storage, networking, power, cooling, facility, operations, software, and amortization — by total tokens produced over the same period. The result is only meaningful if the accounting boundary is stated alongside it.
Fully loaded inference cost includes every input required to serve a request in production — GPU infrastructure, supporting hardware, power, cooling, facility overhead, operations, software, and amortization — as opposed to marginal cost, which reflects only the incremental cost of one additional request.
Fixed infrastructure costs — amortization, facility, power contracts, support — are incurred whether or not the GPU produces useful work. Higher utilization spreads those fixed costs across more useful output, which is often a larger lever on unit economics than the GPU's purchase price.
Utilization measures how busy a GPU is. Efficiency measures how much useful output that busy time actually produces. A GPU can show high utilization while running an inefficient workload — the two metrics need to be read together, not interchangeably.
GPU and server power draw, multiplied by hours operated, electricity rate, and facility overhead (PUE), determines energy cost. Because power draw, tariffs, and PUE all vary by workload and location, there is no single universal figure for the cost of running a GPU.
PUE (Power Usage Effectiveness) equals total facility energy divided by IT equipment energy. A PUE of 1.3 means 30% more energy is consumed by facility overhead — cooling, power distribution, UPS — than by the compute hardware itself. Lower PUE means less overhead cost per unit of useful compute.
Liquid cooling enables higher rack density for high-TDP accelerators but introduces its own capital and operating costs — coolant distribution, pumps, and maintenance. It affects economics through facility capacity and density rather than being inherently cheaper or more expensive in isolation.
It depends on amortized hardware cost, expected utilization, power draw, local electricity rate, facility PUE, and supporting networking and storage costs. There is no universal figure — any quoted number should disclose these underlying assumptions.
Training runs as large, sustained jobs measured by cost per training run or model milestone, with networking often the binding constraint. Inference is request-driven and variable, measured by cost per token or per request, and scales through replication and autoscaling rather than one large distributed job.
It can, particularly for variable or uncertain demand, by converting fixed CapEx and utilization risk into a consumption-based cost. It is not automatically cheaper for every workload — sustained, high-utilization, long-duration workloads can favor ownership once full TCO is modeled.
Two systems can report different cost-per-token figures because of different accounting scope, tokenization, model, context length, batching, quantization, utilization, hardware, or electricity pricing. The metric is only comparable when the measurement boundaries behind it are comparable.
There isn't one universal metric. Cost per token suits token-based API and inference businesses; cost per completed task suits agentic and multi-step systems; cost per GPU-hour and utilization suit infrastructure planning; cost per training run suits model development. The right metric follows the workload.